GoogleトレンドのデータをWebサイトへ埋込む方法
スポンサーリンク

あんまり用途は、、、ですが、「日経平均」、「地震」とかGoogleトレンドの検索回数を取得して、Webサイトに埋め込む方法です。
1) GoogleトレンドのAPIを叩くURLを生成
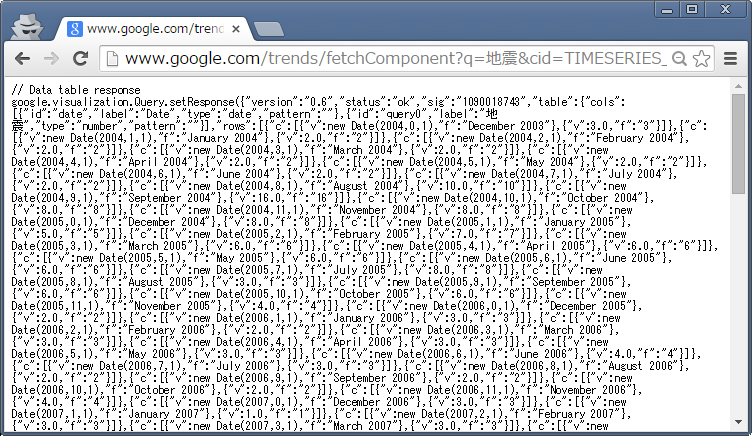
以下のURLの「地震」の箇所を任意の文字列にして、ブラウザのアドレス部に貼り付ける。
http://www.google.com/trends/fetchComponent?q=地震&cid=TIMESERIES_GRAPH_0&export=3

アドレスバーのURLをコピして、テキストに貼り付けるとこんな感じになっていることを確認します。日本語のところが変換されてます。
http://www.google.com/trends/fetchComponent?q=%E5%9C%B0%E9%9C%87&cid=TIMESERIES_GRAPH_0&export=3
2) Google Chartのクエリ部分に上記URLをはりつける
このURLのJanさんのソース丸コピーで恐れ入りますが、以下のソースの「google.visualization.Query」の部分に、1)で取得したURLを貼り付けます。
<!DOCTYPE html PUBLIC "-//W3C//DTD XHTML 1.0 Strict//EN" "http://www.w3.org/TR/xhtml1/DTD/xhtml1-strict.dtd">
<html xmlns="http://www.w3.org/1999/xhtml">
   <head>
      <meta http-equiv="content-type" content="text/html; charset=utf-8"/>
      <title>
         Google Visualization API
      </title>
      <script type="text/javascript" src="http://www.google.com/jsapi"></script>
      <script type="text/javascript">
         google.load('visualization', '1', {packages: ['columnchart', 'linechart']});
      </script>
      <script type="text/javascript">

         var query1, visualization1;
         var query2, visualization2;

         function initialize() {
            visualization1 = new google.visualization.ColumnChart(document.getElementById('visualization1'));
            query1 = new google.visualization.Query('http://www.google.com/trends/fetchComponent?q=%E5%9C%B0%E9%9C%87&cid=TIMESERIES_GRAPH_0&export=3');
            query1.setRefreshInterval(5);
            query1.send(drawVisualization1);

            visualization2 = new google.visualization.LineChart(document.getElementById('visualization2'));
            query2 = new google.visualization.Query('http://www.google.com/trends/fetchComponent?q=%E6%97%A5%E7%B5%8C%E5%B9%B3%E5%9D%87&cid=TIMESERIES_GRAPH_0&export=3');
            query2.setRefreshInterval(5);
            query2.send(drawVisualization2);
         }

         function drawVisualization1(response) {
            if (response.isError()) {
               alert('Error in query: ' + response.getMessage() + ' ' + response.getDetailedMessage());
               return;
            }
            visualization1.draw(response.getDataTable(), {legend: 'bottom', title: 'ColumnChart'});
         }

         function drawVisualization2(response) {
            if (response.isError()) {
               alert('Error in query: ' + response.getMessage() + ' ' + response.getDetailedMessage());
               return;
            }
            visualization2.draw(response.getDataTable(), {legend: 'bottom', title: 'LineChart'});
         }

         google.setOnLoadCallback(initialize);
      </script>
   </head>
   <body>
      <div>
         <div id="visualization1" style="height: 250px; width: 400px; border: 1px solid; float: left;" />
      </div>
      <div>
         <div id="visualization2" style="height: 250px; width: 400px; border: 1px solid; float: left; margin-left: 10px" />
      </div>
   </body>
</html>
するとこんな感じでGoogle Chartに載って表示されます。

ちなみに、chromeだと「refused to execute script from ..... is not executable and strict mime type checking is enabled」とでて実行ができません。(調査中)
参考:Hacking the Google Trends API | TechSlides
追記:ちなみにこんなことしなくても、こちら↓のやりかたを使えば、モット簡単にできます。ryus.co.jp